Basic concepts for reference intervals
See more information
Some useful links
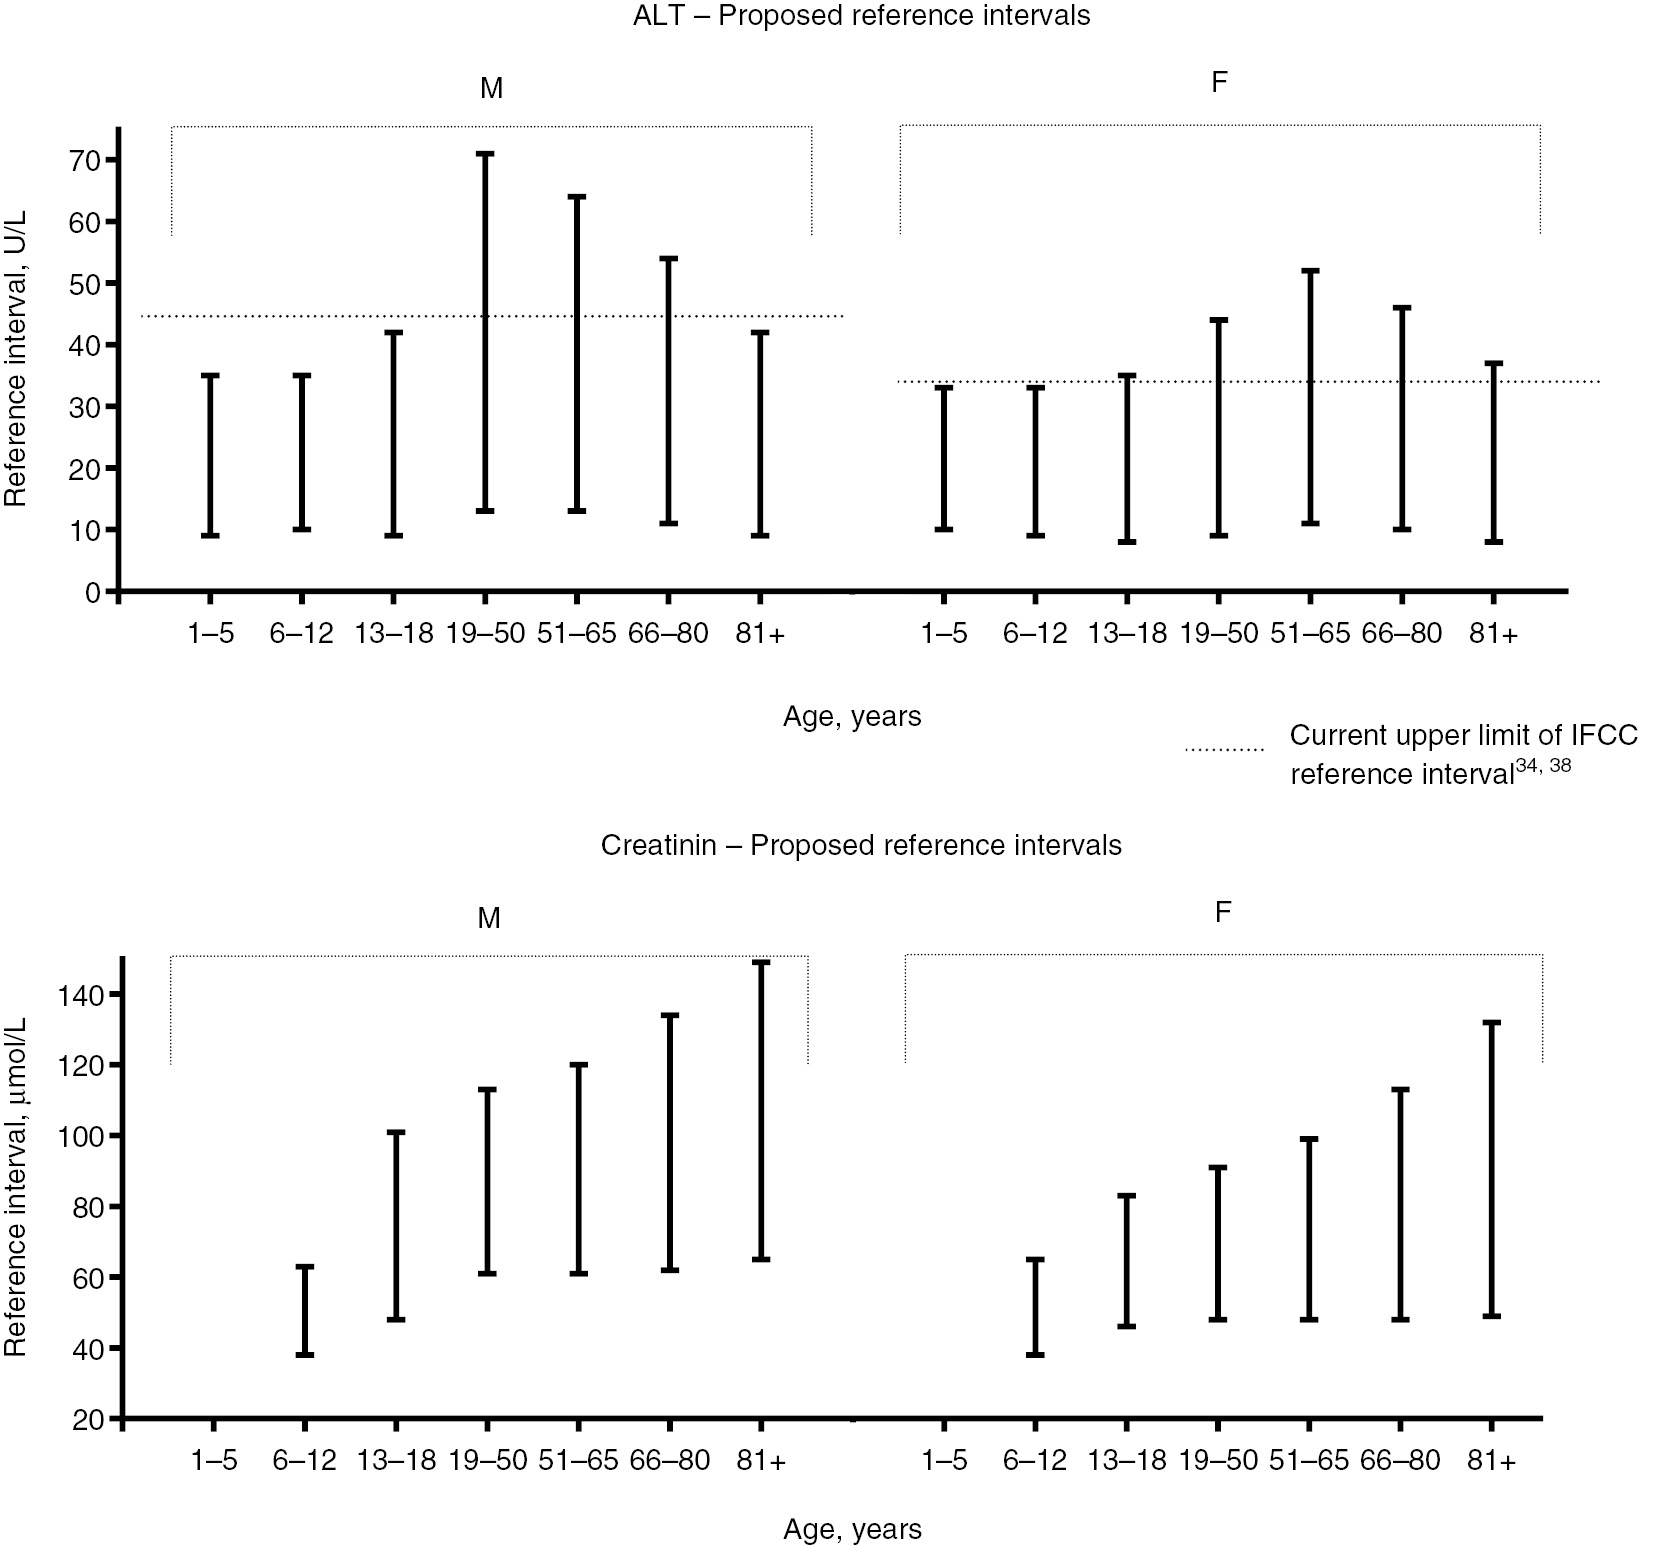
Example of reference intervals for creatinine as a function of age and sex
den Elzen, W., Brouwer, N., Thelen, M., et al. (2018). NUMBER: standardized reference intervals in the Netherlands using a big data approach. Clinical Chemistry and Laboratory Medicine (CCLM), 57(1), pp. 42-56. Retrieved 14 Nov. 2019, from doi:10.1515/cclm-2018-0462
Comparison of methods for obtaining a reference interval
As presented in the Concepts section, there are different methods for obtaining a reference interval. In this section, you can explore the results on samples of a normal distribution defined by its mean and sd. and compare the theoretical reference interval with the estimated intervals in the different methods.
Population parameters
A sample is randomly simulated from a normal distribution with the selected parameters. The reference interval are computed by three methods.
Reference interval for the original distribution
Reference intervals computed from the sample
Sample summary statistics
Compute the reference interval from a sample of a normal distribution
Here we consider you can indicate the mean and standard deviation of a sample for a biomarker of interest. Then, you can compute the corresponding reference interval using the Student's method. The results also show the 95% confidence interval of the reference interval limits. In the figure, we show thereference interval by a red line and the confidence interval for each limit in blue. In this case, we assume the sample comes from a normal distribution.
Estimated reference interval
95% confidence interval for each limit of the reference interval
Read an EXCEL file and compute the reference interval of one variable
You can select an EXCEL file by navigating thorough your file system. Then, you can visualize the variables in that file, select one and obtain the reference interval. As a disgnostic tool, we include the histogram of the selected variable an a QQ-plot for evaluating if the normal distribution is an appropriate model for that variable.
If the sample shows a clear non-normal aspect in its distribution, the Student's method results are not valid. In that case the CI of the ref.int. limits are also non valid.