Law of large numbers
(c) Albert Sorribas, Ester Vilaprino, Montse Rue, Rui Alves. Biomodels Grup, Departament de Ciencies Mediques Basiques. Universitat de Lleida, Institut de Recerca Biomedica de Lleida (IRBLleida
Convergence of the relative frequency to probability
Simulation of observing the relative frequency of an event of a given probability in a series of observations. The relative frequency tends to the probability for a large number of observations
LEGEND
Blue line:
Prediction 95% interval where we expect to find the relative frequency with the especified number of events.
Red line:
True probability. Samples are obtained ramdonly as events of that probability.
Black dashed line:
Prediction 95% interval for the relative frequency of the event at a given number of observations.
Empty dots:
Observed relative frequency at a given number of observations.
(c) Albert Sorribas, Ester Vilaprino, Montse Rue, Rui Alves. Biomodels Grup, Departament de Ciencies Mediques Basiques. Universitat de Lleida, Institut de Recerca Biomedica de Lleida (IRBLleida
The binomial model
The binomial model allows for computing the probability of each of the possible results of observing how many times an event will occur in a given sample. The model assumes that in each observation the probability of the event is constant. The probability of observing \(x\) events in \(n\) observations is computed as: $$P(X=x)= \begin{pmatrix} n\\ x \end{pmatrix} p^x (1-p)^{n-x}=\frac{n!}{x!(n-x)!}p^x (1-p)^{n-x}$$
Probability of a given result
Probability within a range
Expected results
(c) Albert Sorribas, Ester Vilaprino, Montse Rue, Rui Alves. Biomodels Grup, Departament de Ciencies Mediques Basiques. Universitat de Lleida, Institut de Recerca Biomedica de Lleida (IRBLleida
Distribution of relative frequency
Perform a simulation on the relative fequency of an event of a given probability. The red lines in the figure indicates the expected limits for the relative frequency for the 95% of the samples with n observations in each sample. You can indicate the value of probability and the number of observations per sample. Then, you can especify a number of samples and the scale of the figure. In the results panel, the percentage of samples within the theoretical limits is shown. The proportion of samples within the limits should by around a 95%. Try increasing the number of samples so that this proportion converges towards 95%.
Expected 95% results
Observed results
(c) Albert Sorribas, Ester Vilaprino, Montse Rue, Rui Alves. Biomodels Grup, Departament de Ciencies Mediques Basiques. Universitat de Lleida, Institut de Recerca Biomedica de Lleida (IRBLleida

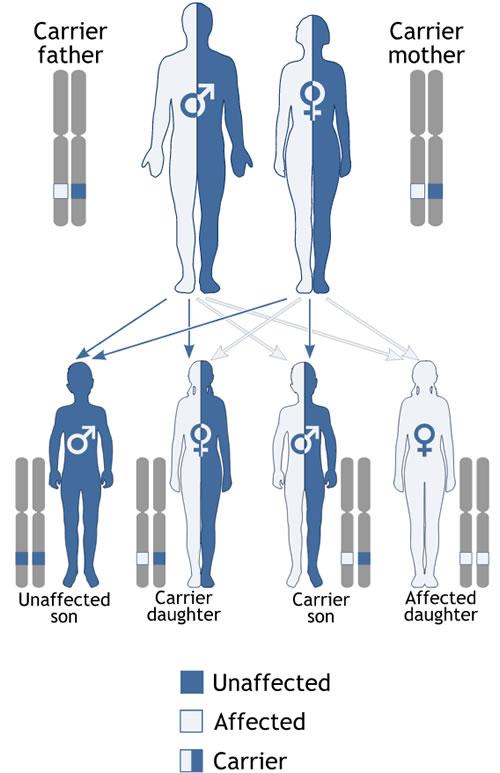
Probability of all the possible outcomes for a family with 4 descendants where both parents are Aa
The result with one descendant AA, one aa, and two Aa has the maximum probability, but not a high probability. In fact, it is much more probable to observe any other result.