Exploring the normal distribution
The normal distribution has two parameters: \(\mu\) and \(\sigma\) and is usually indicated as \(N(\mu,\sigma)\). Is this application you can explore several features of the normal distribution. For instance, given a value of k, the probabiliy of observing a value within the interval \(\mu \pm k \times \sigma \) is always the same for any normal, independently of the parameter values. In when \( k=1.96 \) that probability is 0.95.
The area under two values of X indicates the probability of obtaining values within this two values. For example, if the area is equal to 0.69, this meants tha if we observe a subject from this population its measured value of X will be within this interval in the 69% of the cases.
A sample of individuals will show a distribution (histogram) that is in accordance with the normal curve that represents the behaviour of this variable in the population.
Parameters
In a normal distribution \(N(\mu,\sigma)\), the parameter
\(\mu\) defines the position of the distribution. This
distribution is symmetric with respect \(\mu\).That is:
\(P(X>\mu)=P(X<\mu)=0.5\).
The parameter \(\sigma\) indicates the amplitude of the possible
values of X. The arrow in the graphic show the value of this
parameter fixed in the parameters panel. For a fixed value of
\(k\), the probability of the interval \(\mu \pm k \times \sigma \)
is always the same, independently of the parameter values. The probability
of obtaining a value offside the interval \(\mu \pm 3 \times \sigma \)
is almost 0.
\(P(\mu - k \times \sigma < X < \mu + k \times \sigma )\)
If \(X\) is a \(N(\mu,\sigma), then:\)
The probability \(P(X<x)\) is obtained with the instruction:
pnorm(x,mu,sigma)
The probability \(P(X>x)\) is obtained with the instruction:
1-pnorm(x,mu,sigma)
The probability of an interval \(P(a<X<b)\) is obtained with the instruction:
pnorm(b,mu,sigma)-pnorm(a,mu,sigma)
The value of \(a\) that fulfils \(P(X<a)=\alpha\) is obtained with the instruction:
qnorm(alpha,mu,sigma)
The normal standard: N(0,1)
Computing probabilities
If \(X\) is a normal distribution \(N(\mu,\sigma)\), the the variable:
$$Z=\frac{X-\mu}{\sigma} \rightarrow N(0,1)$$
The \(N(0,1)\) is called normal standard and is denoted by \(Z\)
If \(X\) is a normal distribution \(N(\mu,\sigma)\), then: $$P(X\le x)=P \left( Z \le \frac{x-\mu}{\sigma}\right)$$
If \(X\) is a normal distribution \(N(\mu,\sigma)\), then: $$P(X\le x)=P \left( Z \le \frac{x-\mu}{\sigma}\right)$$
Example
Let's \(X\) be a normal distribution \(N(100,3)\)
Then: $$P(X\le 102)=P \left( Z \le \frac{102-100}{3}\right) = P(Z \le 0.67) = 0.7475$$ In R it is equivalent to compute:
Computing quantiles
The value \(x_\alpha\) that fulfils the equation
$$P(X \le x_\alpha)=\alpha$$
is called quantile \(\alpha\) .
Using the standard normal:
$$P(X \le x_\alpha)=P \left( Z \le \frac{x_\alpha-\mu}{\sigma} \right)=\alpha$$
Then
$$z_\alpha=\frac{x_\alpha-\mu}{\sigma} \rightarrow x_\alpha=\mu+z_\alpha \sigma$$
Example
Let's \(X\) be a normal distribution \(N(50,2)\)
The quantile 0.92 is computed as
qnorm(0.92,50,2), which gives a result of
52.81014
The quantile 0.92 for the standard normal, i.e. \(z_{0.92}\) is
obtained as qnorm(0.92) which gives 1.405072
You can check that:
50+1.405072*2=52.81014
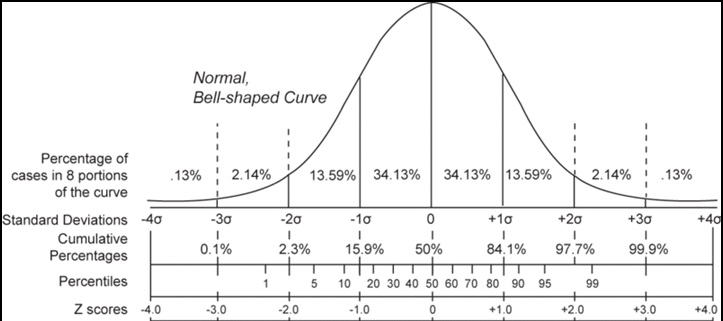
Source: (http://en.wikipedia.org/wiki/File:Normal_distribution_and_scales.gif)
Z-scores
The z-score of an observed value \(x\) of a \(N(\mu,\sigma)\) is: $$z=\frac{x-\mu}{\sigma}$$
If \(\bar X\) is the mean of a sample, and \(s\) is the correspondiong standard deviation, then the z-score is obtained as: $$z=\frac{x-\bar X}{s}$$
Interpretation
The z-score indicates how many times the observed value \(x\) is above (or below in case it is negative) the mean in units of standard deviations.
As z-scores are distributed as a \(N(0,1)\), its value can be read in terms of this distribution. For example, supose a man that has a weight of 90.3 kg. In the population, we have a mean of 80.3kg. with a standard deviation of 5.3kg. In tha case, the z-socre for this man is: $$ z =\frac{90.3-80.3}{5.3}=1.89$$ In a \(N(0,1)\) the \(P(Z<1.89)=0.97\) this means this man has a percentile of weigth of 97 and that few people on this population will have a higher weight.
Z-scores allow comparing variables with different measurement units. For example, if an individual has a z-score of 2.1 for weight and 0.3 for height, this indicates that is close to the mean in height but well above the mean in weight!
Sample statistics
(c) Albert Sorribas, Ester Vilaprinyo, Rui Alves, Montserrat Rue
Biomodels Group
University of Lleida - Institute of Biomedical Research (IRBLleida)