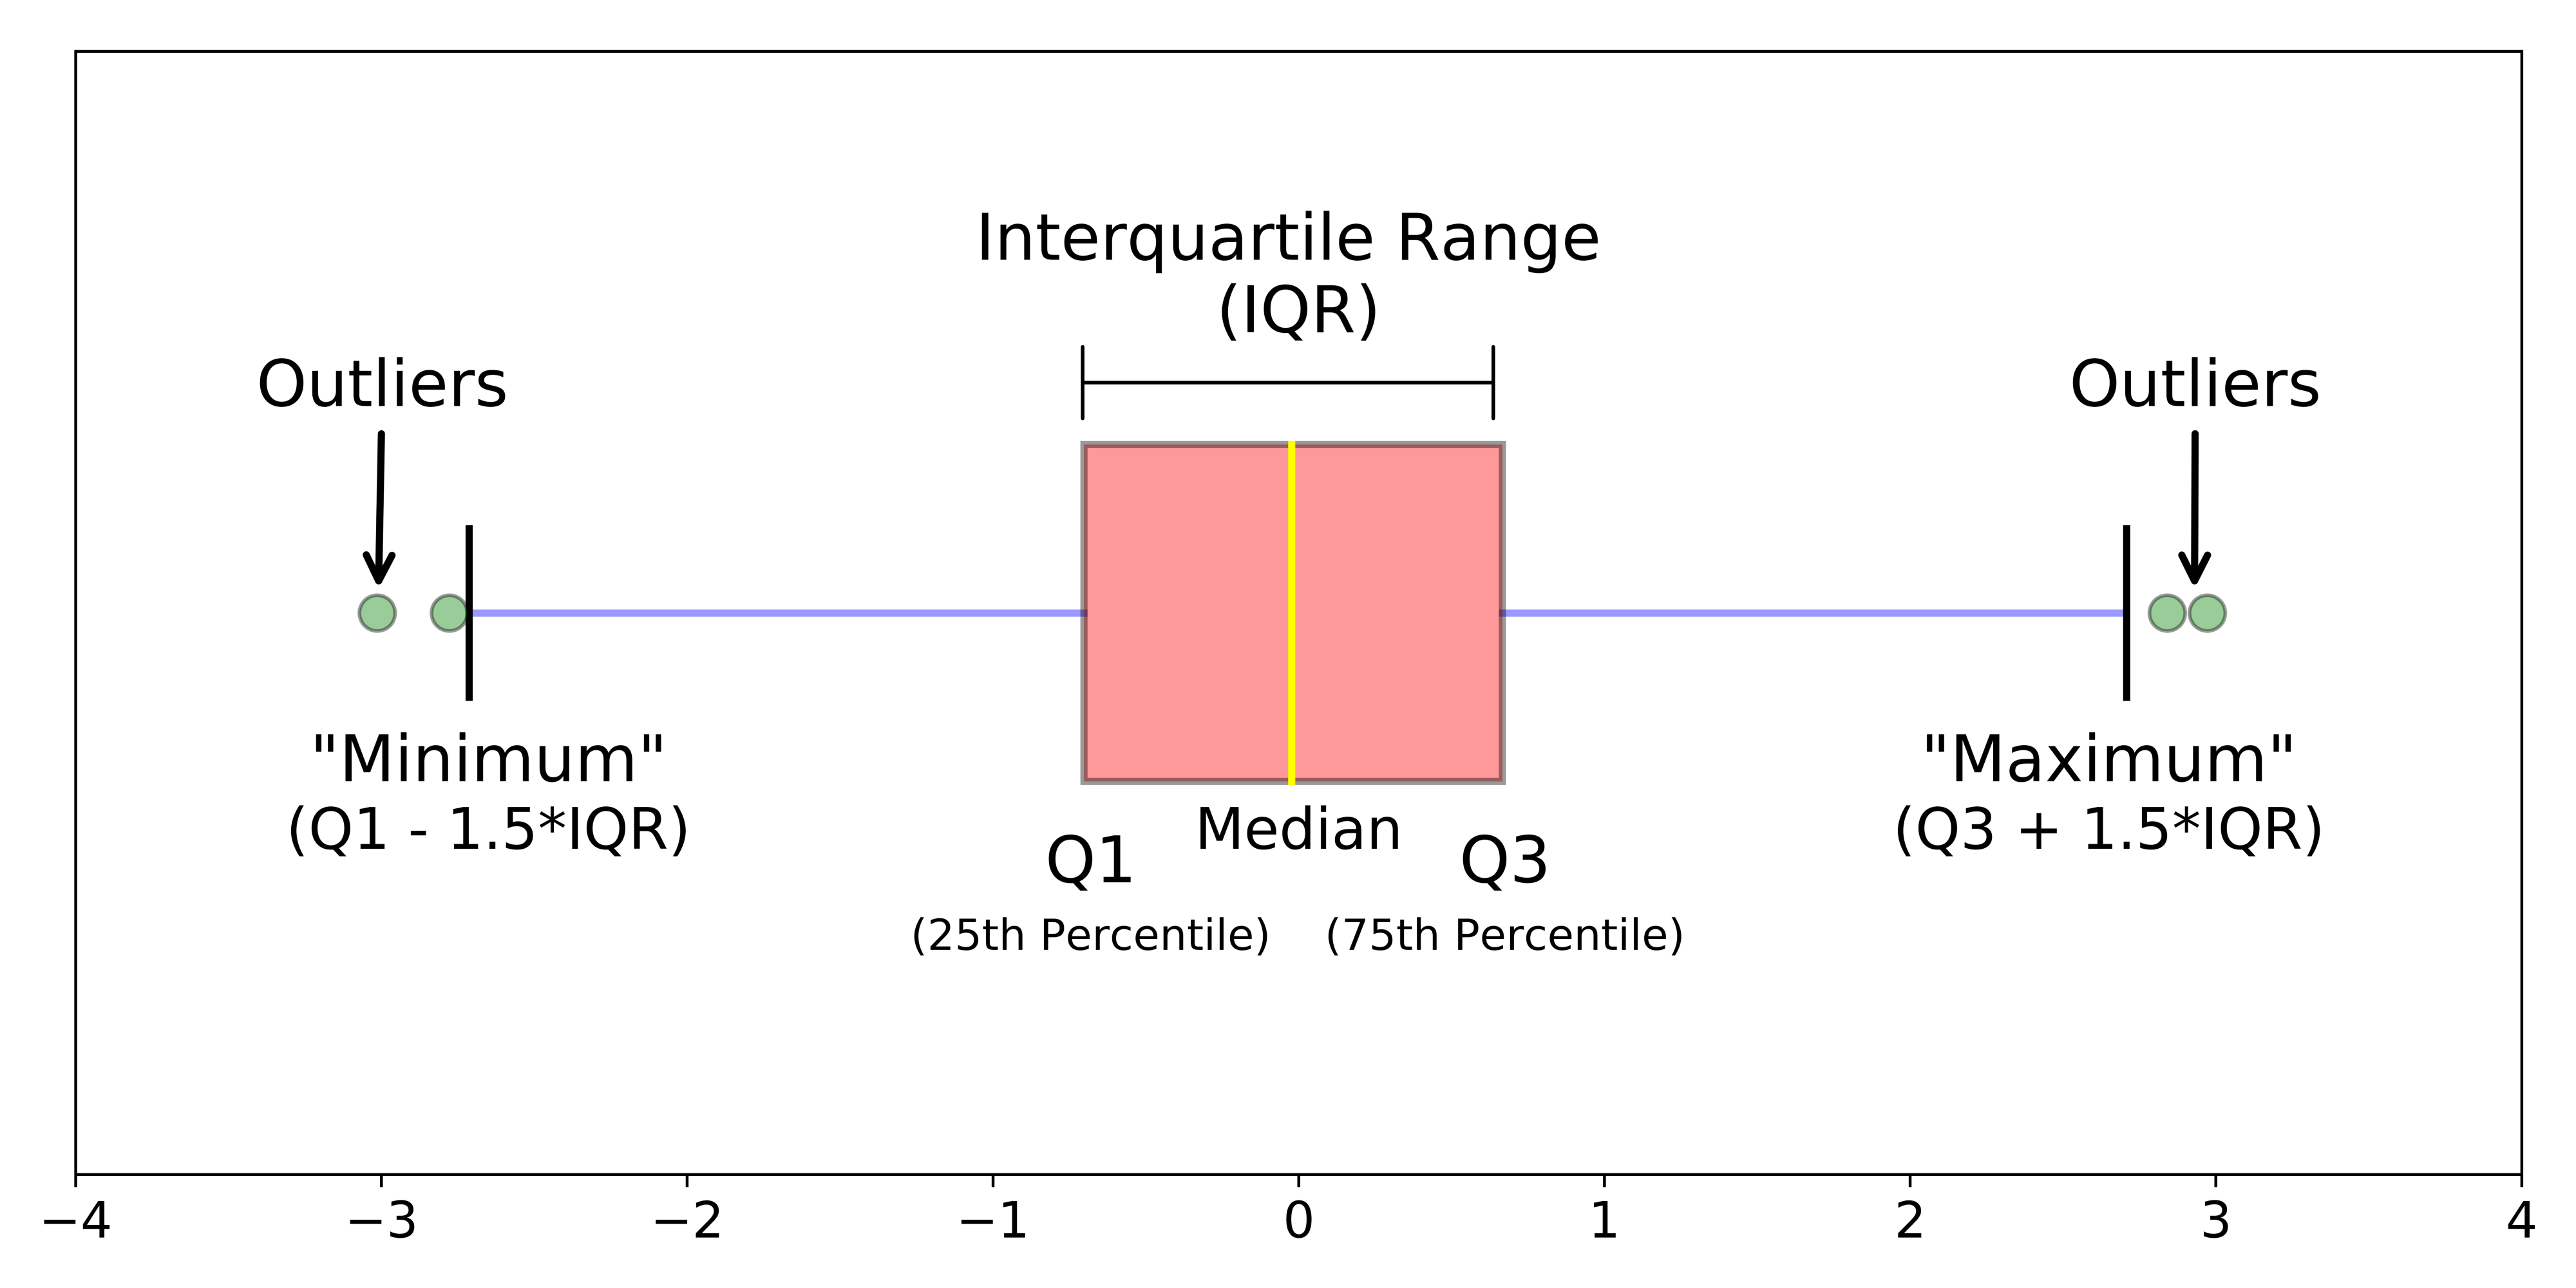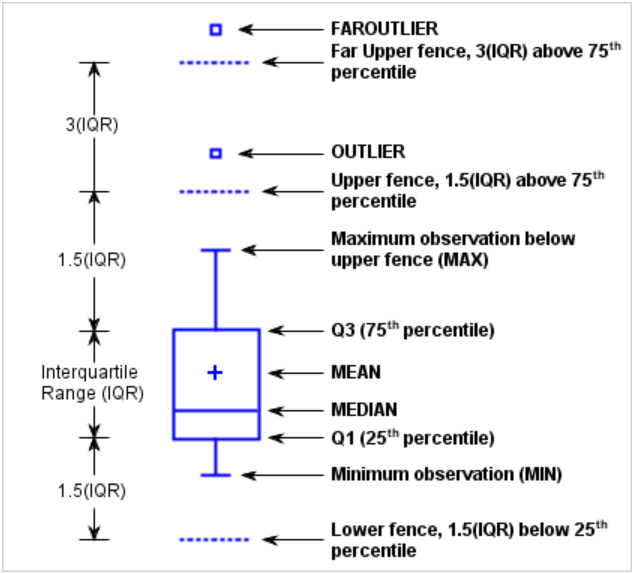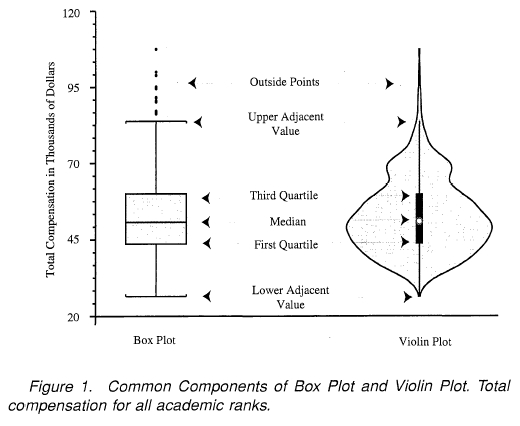

The ChickWeight database has data on the growth of chicks at different times for different diets. You can select the time for obtaining the boxplot corresponding to the weights of the different chicks at that time as a function of its diet.
ChickWeight %>% filter(Time==input$timeval) %>%
                          group_by(Diet) %>%
                          summarize(n=n(),max=max(weight),min=min(weight),
                                       Q1=quantile(weight,0.25),
                                       Q2=quantile(weight,0.5),
                                       Q3=quantile(weight,0.75))
ggplot(ChickWeightd,aes(x=Diet,y=weight))+
                          geom_boxplot()+
                          facet_wrap(~Time,ncol=3)
Examples using ToothGrowth database

Example
